Unlocking animal health data: lessons from two data-driven projects

published on
06/12/2025
written by

Amélie Desvars-Larrive
Amélie is a veterinary epidemiologist at Vetmeduni Vienna and Complexity Science Hub. She studies zoonotic diseases, integrating field epidemiology and data–driven One Health approaches.
How do we transform unstructured data into tools for building stronger health systems?
Veterinary epidemiologist, Amélie Desvars-Larrive shares lessons from two innovative projects that turn animal health data into powerful, usable insights; showing how data can drive effective One Health action.
Animal health data refers to any information related to the health of animals. It encompasses clinical records, pathogen profiles, laboratory results, and epidemiological details. Animal health data plays a critical role in monitoring animal diseases, tracking zoonotic threats, understanding disease patterns, safeguarding food security, supporting public health, and informing policy decisions.
A successful One Health approach relies on seamless data sharing, integration, analysis, and interpretation across sectors. However, animal health data is often unstructured and scattered across diverse agencies, platforms, and publications. Additionally, it comes in various formats and granularity, complicating integration and analysis. These gaps can lead to misinformed decisions, ineffective policies, and misallocation of resources.
The COVID-19 pandemic underscored these challenges. While human case data became readily available in user-friendly formats across multiple channels, and despite global calls for a One Health approach to tackle the pandemic—along with the first reported SARS-CoV-2 case in animals as early as February 2020—structured, readily usable data on SARS-CoV-2 in animals lagged behind. This exposed a critical blind spot in surveillance systems.
This issue extends beyond global frameworks. Working on a project aiming at modelling naturally occurring zoonotic interactions in Austria, my team encountered a major obstacle: the absence of a comprehensive national database cataloguing zoonotic sources and agents. Such a gap – not unique to Austria – constrains our ability to fully understand multi-source multi-agent zoonotic systems.
Over the past five years, our research group has tackled these challenges through two data-driven projects, transforming siloed and unstructured animal health data into FAIR (Findable, Accessible, Interoperable, and Reusable) resources:
- SARS-ANI – This project compiled the first global standardised dataset of SARS-CoV-2 events in animals, highlighting reporting gaps, including underreporting to the World Organisation for Animal Health (WOAH), delayed case releases, and reporting bias toward pet species.
- Austrian Zoonotic Web – This project transformed 47 years (1975–2022) of scattered records into a structured, FAIR dataset of zoonotic interactions in Austria. Findings revealed domesticated, game, and synanthropic animal species as posing the highest risk for zoonotic spillover in Austria and revealed the emergence of at least eight zoonotic agents in the country during this period.
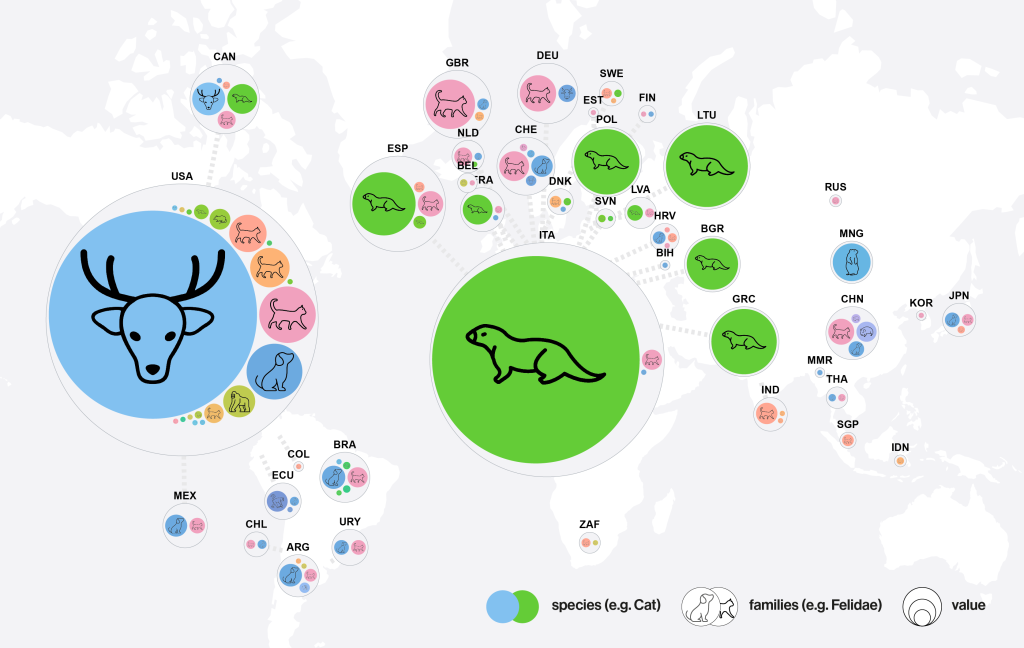
Screenshot of the SARS-ANI dashboard: distribution of the reported SARS-CoV-2 events in animals.
An “event” = one single animal case or several epidemiologically related animal cases were identified by the presence of viral RNA and/or antibodies.
Circle size = cases; color = animal species; animal symbols = taxonomic families.
Data sources: WAHIS and ProMED–mail. Data retrieved from Github on 22 January 2025. Image by Amélie Desvars-Larrive, CC BY IGO 3.0
Both projects relied on publicly available information. The SARS-ANI dataset consolidates data on SARS-CoV-2 events in animals from the Program for Monitoring Emerging Diseases (ProMED-mail) and the World Animal Health Information System (WAHIS) of the World Organization for Animal Health (WOAH), from 2020 until today. We subsequently enriched it with data from preprints and peer-reviewed publications.
For the Austrian Zoonotic Web project, we performed a systematic search of scientific literature and national surveillance reports to collect epidemiological data on reported zoonotic interactions in Austria.
However, manually extracting and structuring data was a labour-intensive task! While automated methods like web scraping and machine learning hold great potential, manual oversight and human expertise remain indispensable for validating complex health data, linking epidemiological events, or resolving inconsistencies. To streamline this, we used Excel for data compilation and the open-source free software environment R for systematic data cleaning, addressing issues like duplicates, typos, and missing values. Veterinary students from Vetmeduni Vienna played a key role here, leveraging their specialized knowledge to ensure high-quality data extraction and validation.
Accurate species identification—whether animals, vectors, or infectious agents— is a prerequisite for preventing ambiguities, ensuring data interoperability, and generating actionable insights. One of our biggest challenges? Taxonomic inconsistencies. Many species names were outdated, incorrect, or incomplete across sources. To resolve this, we validated and standardised nomenclature using the NCBI Taxonomy Database and the R package taxize.
To maximise impact, we adhered to FAIR guiding principles for data management and stewarship, which means we ensured that our datasets were:
- Findable – Data was assigned Digital Object Identifiers (DOIs) for easy identification and location;
- Accessible – Static datasets were stored in trusted, open repositories like Figshare and Zenodo, ensuring data preservation and easy access;
- Interoperable – Common formats like .csv and standardized terminology ensured cross-sector and cross-discipline usability;
- Reusable – Clear licensing (we opted for the CC BY 4.0 licence) and documentation were provided to support data reuse.
We did not stop at sharing data alone. We provided codebooks (detailing all fields and code used), documented R scripts to explore the data, reproduce our results, and provide a starting point for further analyses, and README files that offered guidance on how to work with the dataset, including step-by-step instructions for getting started with R. This made the data not only accessible but also actionable for others, ensuring transparency and reproducibility. We also shared information sources either through embedded links within the dataset or as documents in a separate folder.
For SARS-ANI, we took it a step further by leveraging the more flexible platform Github for regular updates—initially weekly and now monthly—ensuring users have access to the latest available information.
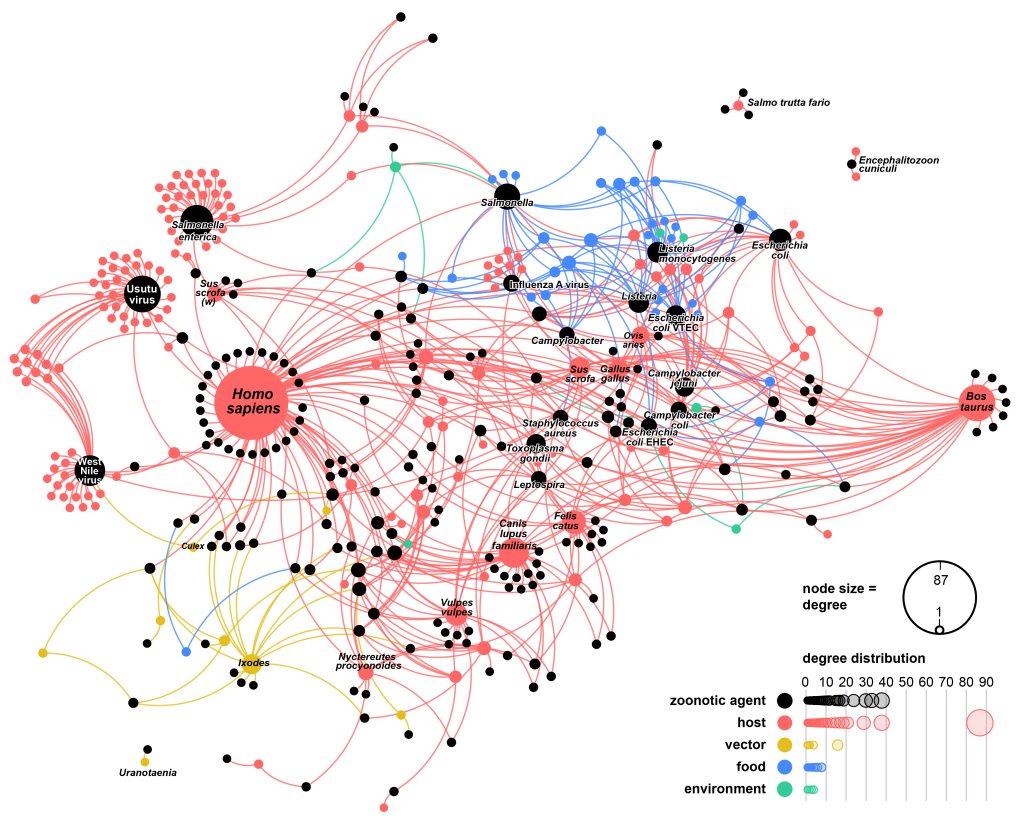
Network representation of naturally occurring zoonotic interactions (“zoonotic web”) in Austria, 1975-2022.
Each node of the network (circle) represents an actor in the zoonotic web, with one set of nodes (coloured in black) representing zoonotic agents.
The second set representing zoonotic sources that belong to different categories: vertebrate hosts (red), arthropod vectors (yellow), foodstuffs (blue), and environment (green).
A link between a zoonotic source and an agent indicates that the agent was directly or indirectly detected in the source.
Image by Amélie Desvars-Larrive, CC BY 4.0, via Springer Nature.
Visualising data is more than just presenting numbers or charts—it’s about telling a story. To make complex animal health data more accessible and engaging, we worked with a visualisation expert from Complexity Science Hub.
SARS-ANI VIS was the first global dashboard tracking SARS-CoV-2 events in animals. For the Zoonotic Web, we developed interactive visuals including a scrollytelling article and an interactive dashboard. These tools not only enhanced communication across scientific, policy, and public audiences, but also fostered greater engagement with animal health data, the epidemiology of zoonoses, and the One Health concept.
One Health surveillance is only as effective as the data it relies on. Without equitable, timely, high-quality, and FAIR data, our ability to predict, prevent, and respond to health threats at the human-animal-environment nexus remains limited. For this reason, I strongly believe that we should all:
- Promote free, permanent data access – Use open-access repositories;
- Improve data/metadata standards – Enhance data discoverability and reusability;
- Adopt a human-in-the-loop approach – Combine computational tools with expert validation to maintain data reliability and accuracy;
- Invest in data literacy – Train professionals in data management and analytics, especially within the veterinary workforce.
- Recognise contributions – Credit sources and teams for their efforts.
- Enhance communication – Create user-friendly and engaging visualisations to reach diverse audiences.
By collaboratively addressing these challenges, we can strengthen animal health data, ultimately improving integrated One Health surveillance and early warning mechanisms, shaping a future where data drives smarter, faster, and more effective health decisions.
Acknowledgements
I would like to express my sincere gratitude to Eliza Muto, Anja Böck, Liuhuaying Yang, and Gavrila Amadea Puspitarani for their insightful feedback on the text.
The Animal Echo aims to promote individual and collective understanding of animal health and welfare. We bring you insights and opinions from experts across the world. The opinions expressed in The Animal Echo are those of the author (s) and may not necessarily reflect WOAH’s official position.
Continue reading


Receive the latest updates from our Organisation, network, and partners.
This includes Members’ self-declarations, news articles, scientific insights, publications, and more.
